Presenting Machine Learning Model Results as Business Insights
How to present machine learning model performance as actionable insights to Business.

Machine Learning and Deep Learning have been some of the most revolutionary technologies of our generation and have the potential to radically redefine our way of life. With this much hype surrounding a technical stack, it can often take a life of its own and it is very easy to forget that at the end of the day it is just another tool to add value to our businesses that serve the customer at its center.
I have been working at one of the largest banks in the world for over 2 years now as a Machine Learning Engineer, and if I could summarize my experience in a few words it would be.
“If you can’t write your message in a sentence, you can’t say it in an hour.” -Dianna Booher
And it is true for any engineer working with their business or clients, they neither care what great technology you have used, nor how complex your solution is but only how much value can this solution add to their business.
To that extent, through this guide, I will make an effort to present to you some ways that I have often used to some degree of success while presenting my work to business.
Part 1: Show it, don’t say it.
There is a reason why Salesforce spent over $15 billion dollars to acquire a Data Visualization/Reporting tool called Tableau. The value of a graph rising up over time is much more than a thousand words could convey.
Let us look at few ways to present your results.
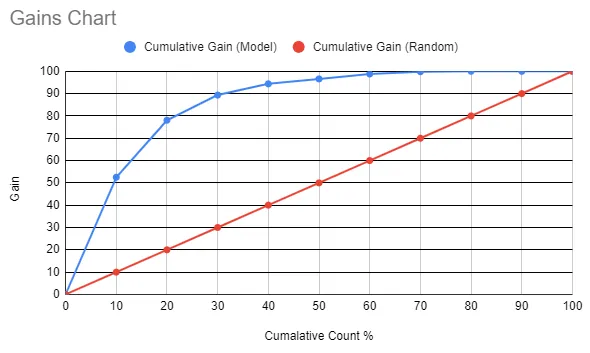
Gains Chart represents the cumulative bad capture rate of your model. (Image by Author) Gains chart is a very useful tool when you are working with models which produce continues probability score, as these values can be sorted and accumulated to show how much of event you are able to capture using the model, compared to random case.
For example in this case we can see our model is able to capture 80% of events in the top 20% scored data, which means if a business focuses on just the top 20% of the total observations scored, it can capture up to 80% of events using your model.
This helps businesses understand the value your model brings to the table, and how it can help them make better decisions.
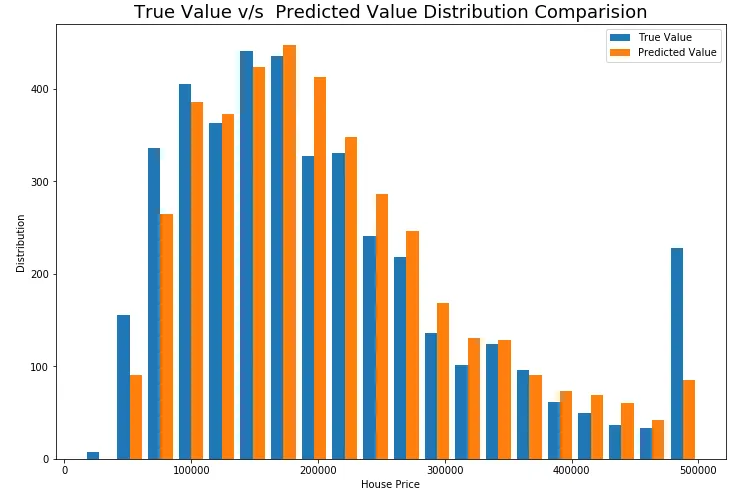
Plotting the distribution of predicted values over the distribution of true value. (Image by Author) When working with regression models it can often be tricky to present your model results to business teams, as you don’t want them to go through all the residual analysis and multivariant analysis.
An overlapped distribution histogram of True vs Predicted values is a great way to present how well your model results compare with reality. This will help the business understand if your model is good enough to replace the existing system in place.
Part 2: Measuring ROI in Machine Learning Models
Just because you have a great model with an amazing tech stack and a full-proof product design, does not mean the business owes it to you to approve the funds to build it, I learned that the hard way, you shouldn’t.
Have a cost-benefit analysis when you present to the business any product design or model designs. No matter how cool or inspired your model is, no one would approve it if it did not justify the cost.
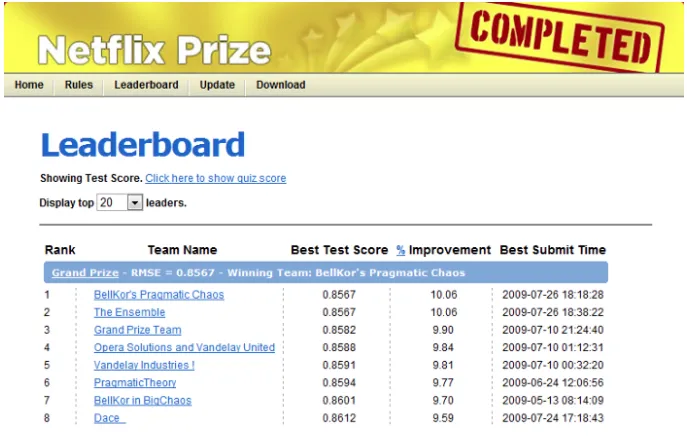
In 2006 Netflix spent $1 million to fund a competition to find an improved solution to their movie recommendation system but did not end up using even the state of art solutions presented, as “The additional cost of engineering and maintenance does not justify the improvement in accuracy”.
Understand the Cost of Confusion
To calculate the cost vs benefit of a simple binary classifier you can look at the confusion matrix and assign value to each cell.
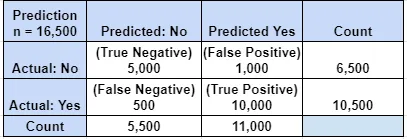

Consider the example, you are tasked with building a model to predict customer churn for a credit card company. You are excited and inspired and go ahead and build a piece of beauty for them, with results similar to this.
Now some business analysts do the cost-benefit analysis for you, Lets us see what they find. As per their analysis company loses about $20,000 per customer (Cost of False Negative) in lost revenue and other costs for the period of prediction, once a model is put in place it would cost the company around $1,000 (Cost of both False Positive and True Positive) to try and retain the customer. Let us see how your model does.

Now of course I manipulated the number a little to get the results, but the point remains, also I still ignored the engineering and maintenance cost of the entire thing. The point is, sometimes machine learning is not the solution or at least not the most viable solution.
As a Machine Learning Engineer, it would help you a long way if you learn how to figure out early in your project minimum viable performance.
Part 3: Be Part of the Solution
No matter what your final results are, always provide a list of recommendations on the next steps. You are paid to solve problems not just find and evaluate them. It also shows your ability to look above and beyond your own space of work.
If your model works and is financially viable.
Suggest a product development roadmap and timeline. How existing teams/Infra can be involved to reduce the cost. What improvements will future versions possibly bring? If your model is not feasible.
Suggest a few off-the-shelf products available in the market. How a rule-based solution will perform compared to a model.
Conclusion
Unless and until you are ML/DL Researcher, presenting your solutions will be a big part of your job, and just like any other job, this is something you will learn with practice. The early you can horn your presentation skills the smoother the ride will be for you.